Manage the loss first
In trading, the first job is to manage the loss: every firm ends your account at a set loss. Start from how many losing trades in a row you can take, then see what it takes to reach the target. The account's own rules, your numbers: a calculation, not a promise.
Your three numbers
- stop after 2 losses
- stop at −$563
- stop when up +$400
Today
Bulenox Fast Track $50KBefore each trade
Bulenox Fast Track $50KYour real capital is $2,250, not $50,000: 11 losing trades in a row end your day, 20 end the account. Size every trade so a normal losing streak cannot reach those limits, and stop for the day before the firm stops you.
The loss side
your edge: +0.13R · $14 a trade on averageYour own limits stop you first: after 2 losses in a row, or 5 losses ($563).
End of day: the floor rises with your best closing balance, so after a run of winning days it takes fewer.
Over a typical run of 133 trades at a 55% loss rate, a losing streak of 7 or more happens in 60% of runs and one of 10 or more in 13%. The account ends at 20 losses in a row.
| Losses in a row | All lose next | In a day | In 100 trades | In a typical run |
|---|---|---|---|---|
| 2 · Your stopends the day by your choice | 30% | 44% | 100% | 100% |
| 11 · Daily loss limitthe firm ends the day | 0.1% | — | 5.6% | 7.5% |
| 20 · Max drawdownthe account is lost | 1 in 155,864 | — | 1 in 4,213 | 1 in 3,006 |
“All lose next” is the chance that the coming trades are all losers. The other three columns are the chance that such a streak happens at least once: in a day of 3 trades, in 100 trades, and in a typical run of 133 trades (the simulation's median), the streak that ends accounts. All are exact, from your win rate.
The gain side
goal $2,500 · $169 a winNet of losses it takes more trades: the simulation counts them.
Trade by trade at your win rate, under the firm's rules and your limits.
| Winning trades in a row | Chance in a row | What it means |
|---|---|---|
| 15 wins of $169 | 1 in 159,152 | the first target in one go: the one-day rush |
| 8 wins of $169 | 0.2% | half of the first target in one go |
Consistency
best day ≤ 20% of the profit for a payout$2,500 × 20%: past it, that day is too big.
At 20%, no single day can carry the goal.
80% of the most allowed: room for smaller days.
From the 2nd payout the firm's limit is 30%.
Already had a big day? Check before you ask for a payoutEnter your best day and your total profit.
10,000 simulated runs to your payout goal
same seed every timeAssumes a fixed stop (−$113) and target (+$169), independent trades at a 45% win rate, the same size every trade, $0 of costs a trade, no slippage; Bulenox's rules as published, checked Sep 26, 2026.
What this does not model
Variable R (stops and targets that move) · partial exits · news gaps · slippage · correlated trades · the firm's discretion · taxes.
The same strategy copied onto several accounts shares one outcome: they pass or fail together, so the odds above do not improve. Trading opposite sides across accounts to push one through (“hedged passing”) is prohibited by the firms that state a rule on it, and this planner never suggests it.
These figures treat each account as its own attempt, the best case, with the chance of one attempt from the simulation above. Each account is bought once: resets are not counted.
Left out of this run: the time limit (not published: no deadline is applied) and the firm's limit on contracts (stated in a form this planner does not read). Other rules (news trading, time limits, a minimum profit for a day to count, scaling) are not simulated: read the firm's own page.
Your first payout
Fast TrackFunded from a fresh start, with your numbers: 10,000 runs trade until the first payout can be asked for, the account is lost, or 120 days pass.
- Startday 0
- First payoutday 57
- Second payoutinterval not published
| Payout | Earliest day | Profit needed | Request | You keep | Balance after |
|---|---|---|---|---|---|
| 1 | day 5 | +$3,000 | $2,000 | $2,000 | $51,000 |
| 2 | day 9 | +$2,000 | $2,000 | $2,000 | $51,000 |
| 3 | day 13 | +$2,000 | $2,000 | $2,000 | $51,000 |
Payout 1 waits for the $3,000 target, 2 and 3 for the $2,000 target; a request takes at most $2,000.
Each request takes the most the cap allows and each cycle makes just the profit its rule asks for. Days are the earliest the rules allow, a trading day counting as one.
What this stage publishes
- Profit split
- 100% of the first $10,000, then 90%
- Profit goal
- $3,000 of profit before the first payout
- Payout cap
- $2,000 a request
- Minimum payout
- $1,000
Not published by the firm, so left out of this run: how often a payout may be asked for (the second payout has no day). A day here is a trading day, counted as one day of the firm's own day rules.
Cost to reach your goal
price, resets, fee after passing1.2 attempts on average: $293 for the first, $293 for each of the others
Nine times in ten one of these 2 attempts passes: $293 for the first, then $293 each time
The firm publishes no reset price: each attempt after the first is counted at the full price again, $293.
Ways to size, compared
your plan 10,000 runs · the others 5,000 each| Way to size | Reached | Account lost | Daily limit hit | Median days |
|---|---|---|---|---|
| Same size every tradeyour plan as set | 84.6% | 10.0% | 0.0% | 47 |
| Half size near the floorwhen less than a third of the drawdown is left | 84.2% | 5.2% | 0.0% | 47 |
| Half size after 2 lossesback to full size after a win | 81.6% | 5.6% | 0.0% | 55 |
| Build a buffer firsthalf size until the floor locks | 55.0% | 0.7% | 0.0% | 83 |
The same trades, sized four ways. Half size when the floor gets close is the most common advice: it trades a little speed for fewer lost accounts. The best figure of each column is in accent.
If you risked…
your row 10,000 runs · the others 2,000 each| Risk a trade | Reached | Account lost | Median days | Cost to get funded |
|---|---|---|---|---|
| 1% of the drawdown$22.50 a trade | 0.1% | 0.0% | 113 | $195,333 |
| 2.5% of the drawdown$56.25 a trade | 52.3% | 0.3% | 85 | $560 |
| 5% of the drawdownyour plan$112.50 a trade | 84.6% | 10.0% | 47 | $346 |
| 7.5% of the drawdown$168.75 a trade | 77.3% | 22.2% | 29 | $379 |
| 10% of the drawdown$225 a trade | 64.3% | 35.7% | 26 | $456 |
The same win rate, reward, stops and rules at other sizes of risk: only the risk changes. Your own row is the simulation above; the best figure of each column is in accent.
The drawdown floor
end of day, locks at the starting balanceIt follows your end-of-day best balance, $2,250 below it, until it reaches the starting balance.
About 54 days at your average day ($42). Until then, a losing run after a good day costs twice: trade half size until it locks (“Build a buffer first” above).
Rushing against your plan
the same win rate and reward| Measure | Your plan | Rushing |
|---|---|---|
| Risk per trade | 5.0% of the drawdown · $113 | 100% of the drawdown · $2,250 |
| Your limits | on | none |
| Reached | 84.6% | 0.0% |
| Daily limit hit | 0.0% | 98.5% |
| Account lost | 10.0% | 1.5% |
| Expected cost to get funded | $346 · 1.2 accounts bought per pass | $732,500 · about 1 pass in 2,500 accounts |
Rushing sizes each trade so an average day makes the first target in one session ($2,500 in 3 trades, capped here at your whole drawdown: one loss ends the account). Its 20% consistency rule also caps any single day. Same win rate, same reward: only the size and the limits change.
Kelly and the risk of ruin
what the formulas sayKelly = win rate − loss rate ÷ reward = 0.45 − 0.55 ÷ 1.5 = 8.3% a trade, applied here to your real capital, the $2,250 drawdown. Full Kelly grows fastest with deep swings on the way; most traders use a quarter to a half of it. You are at 0.6 Kelly: above half, losing runs get long.
The chance a losing run eats the whole drawdown (20 losses of room) if you traded these numbers without end, on one account.
The real figure for this account: its daily limit and its targets included.
Risk of ruin ≈ e^(−r × U), where U is the losses of room (the drawdown ÷ the risk of one trade) and r solves p · e^(−r × reward) + q · e^(r) = 1 (p the win rate, q the loss rate). Kelly and ruin assume trades of the same size, one after another.
My plan
keep it beside your chart, share it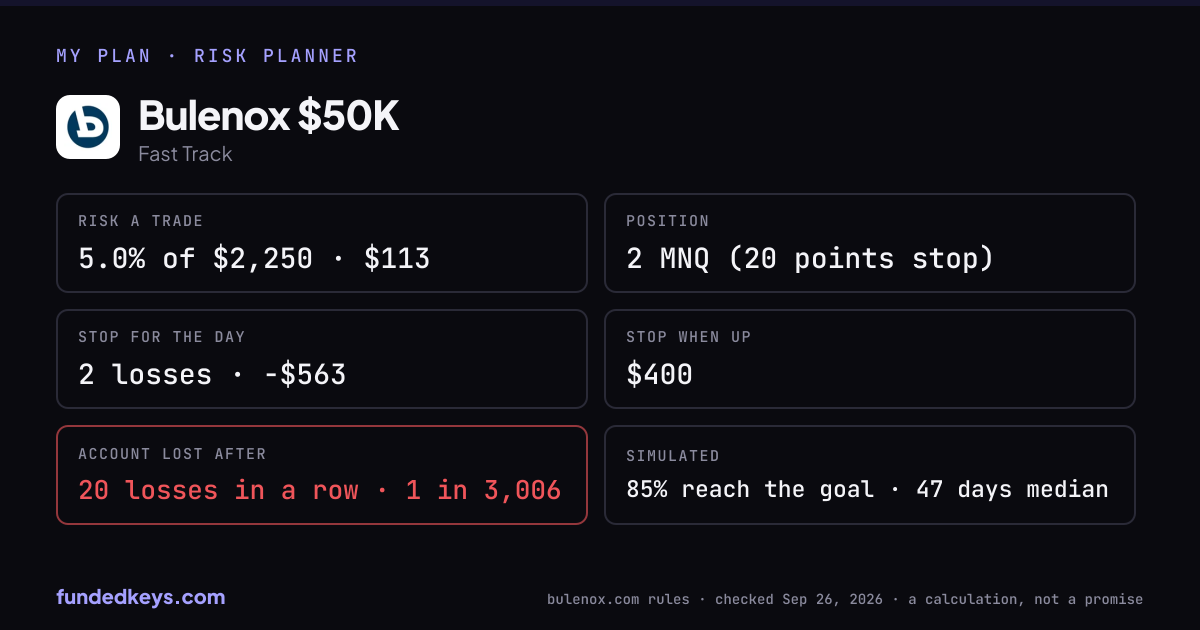
MY PLAN · Bulenox Fast Track $50K
Risk per trade: 5.0% of the $2,250 drawdown ($113) · reward 1.5R · win rate 45% (my estimate)
Position: 2 MNQ (20 points stop)
Stop for the day: after 2 losses in a row or at −$563
Stop for the day when up: $400 (consistency 20%)
The firm ends the day after 11 losses in a row, the account after 20 losses in a row (1 in 3,006 over a typical run)
Simulated with these numbers: 85% reach the goal, median 47 days
Rules from bulenox.com, checked Sep 26, 2026 · fundedkeys.com/tools/risk-planner
The card is this plan's share image: posted in Discord, Telegram or X, the link opens this exact plan.
Each run trades your numbers under the account's rules: its daily loss limit, its max drawdown (static, trailing, end of day or locking at the starting balance as the firm states it), its targets, its minimum days and its consistency rule, and under your own limits. A rule the firm does not publish is left out and named. Rules of the accounts are data of Oct 14, 2026. A calculation, not a promise. Check your own days in the consistency calculator
Eight money-management rules for a funded account
The same plan in words, with the numbers of the account above (Bulenox Fast Track $50K): a $50K account whose real capital is $2,250. A calculation, not a promise.
Size from the drawdown, not the account
The money you can lose is the max drawdown, not the account size: $2,250 of real capital on a $50,000 account. Risk a fixed share of it on every trade: 5.0% is $113 and leaves room for 20 losing trades in a row.
Know your losing streak before you trade
Losses come in runs. At a 45% win rate, 2 losses in a row happen on 44% of days of 3 trades, and the 20 that end the account have a 1 in 3,006 chance over a typical run of 133 trades. Know both numbers.
Set your own daily loss limit below the firm's
The firm's daily loss limit is where it stops you; yours should come first. $563 (25% of the drawdown) is 5 losses at this size, against 11 for the firm.
Stop for the day after a short losing streak
Stopping after 2 losses in a row ends a bad day early, before it becomes the day the firm ends. The simulation applies it as your own limit.
Cap a winning day where a consistency rule applies
This account limits the best day to 20% of the profit. A day that makes much more than the others slows the pass or the payout: stop for the day when you are up, and let the total profit dilute your best day.
Do not rush the target
Sizing up to make the target in one day is the fastest way to lose the account: at $2,250 a trade (100% of the drawdown) the simulated chance to reach the target is 0.0%, against 84.6% for the plan above.
Respect the floor
A trailing or end-of-day floor rises with your best balance: after a good run the room you have is smaller than $2,250. Half size when the floor gets close trades a little speed for fewer lost accounts: here 10.0% of runs lose the account at the same size every trade, 5.2% at half size near the floor.
Price the failures, and run the plan again when the rules change
At 84.6% of runs reaching the target, an account costs about $346 per pass on a $293 purchase. Firms change their rules: check the date of the rules, run the plan again, and remember that a simulation is a calculation, not a promise.
Risk planner questions
What is the difference between a static, a trailing and an end-of-day drawdown?
A static drawdown is a floor a fixed amount under the starting balance that never moves. A trailing drawdown follows your highest balance as you trade, an end-of-day drawdown follows it only at the close of each day, and some trailing floors stop rising at the starting balance. Of the 1,326 accounts in the planner, the drawdown is static on 627 accounts, trailing until it locks at the starting balance on 271, trailing during the day on 115, trailing at the end of the day until it locks on 108 and trailing at the end of the day on 79. 126 do not state the type; the planner then keeps the floor fixed.
Why size trades from the drawdown and not from the account size?
Because the drawdown is the money you can lose before the account ends, and it is not a fixed share of the size: across the 1,326 accounts in the planner, half have a drawdown between 5% and 8% of the account size, with a median of 6%. Two accounts of the same size can leave very different room for losing trades.
How much should I risk per trade on a funded account?
Little enough to survive the losing streaks your win rate makes likely. For the risk you enter, the planner shows how many losses in a row end the day and the account, and the chance of meeting such a run; the fewer losses the drawdown can take, the smaller each trade should be.
How does the daily loss limit enter the plan?
In the simulation, reaching the firm's daily loss limit ends the run, and your own daily limit, set lower, stops the day before it. 1,071 of the 1,326 accounts in the planner state a daily loss limit; on the other 255, only the maximum drawdown and your own limit stop a bad day.
How does the planner apply a consistency rule?
A consistency rule caps the share of the profit a single day may hold. The planner applies the firm's limit while passing, or before a payout on an instant account, and counts a run that reaches the target with too large a best day as blocked, not passed. 406 of the 1,326 accounts state a limit it applies, from 15% to 52%; 581 state there is none, and 339 publish none or word it in a way the planner does not apply.
Is the simulated pass rate a prediction?
No. It is a calculation from the numbers you enter, run 10,000 times under the account's published rules with a fixed seed, so the same inputs always print the same figures. The rules are those checked up to Oct 14, 2026; firms change them, so run the plan again before you buy.
How the numbers are made
Losing and winning streaks are exact, from your win rate (a small dynamic program, no simulation). The simulation runs 10,000 challenges trade by trade with a fixed seed, under the account's own daily loss limit, drawdown floor, targets, minimum days and consistency rule, and under the limits you set; the same inputs always print the same figures. Position sizes use the exchange's contract values for futures and the usual lot sizes for forex. Every rule comes from the firm's own pages, with its date.
Rules by account: consistency calculator · methodology
Risk calculators by firm
One page for each of the 47 firms, opened on its $100K account with the lowest real cost (its largest account where it has none), with that account's own rules and figures.
- Alpha Futures
- AquaFunded
- AtmosFunded
- Audacity Capital
- BitFunded
- Blue Guardian
- Blueberry Funded
- BluSky
- BrightFunded
- Bulenox
- City Traders Imperium
- CryptoFundTrader
- Earn2Trade
- Finotive Funding
- ForTraders
- FTMO
- FTMO Futures
- FTUK
- Funded Elite
- Funded Futures Network
- Funded Trader Markets
- FundedSquad
- FunderPro
- Funding Pips
- Funding Traders
- FuturesElite
- FXIFY
- Goat Funded Futures
- Goat Funded Trader
- Hola Prime
- HyroTrader
- Instant Funding
- IQ Capital
- Maven Trading
- Orion Funded
- Phidias
- Phoenix Trader Funding
- PropShopTrader
- Purdia Capital
- Rebels Funding
- The5ers
- ThinkCapital
- TopOne Trader
- TradeDay
- TraderScale
- Vanta Trading
- Leeloo Trading